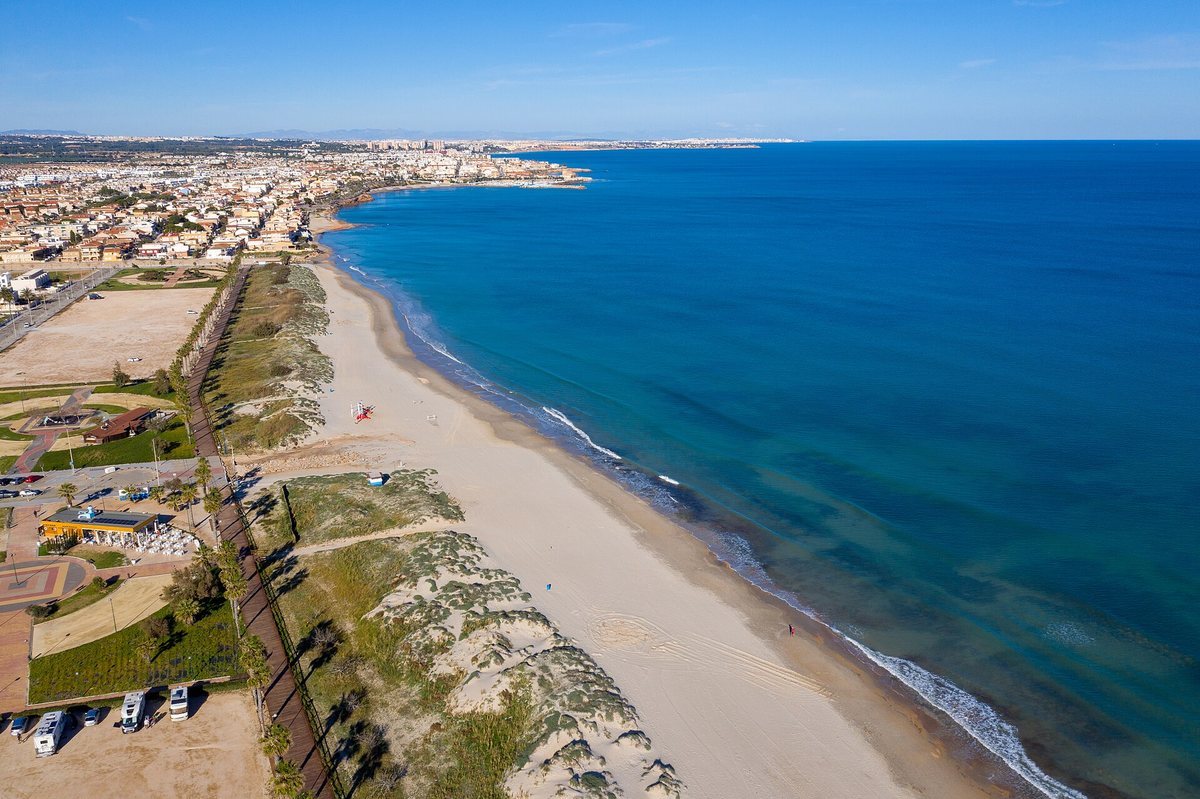
January
- Max / min
- 16° / 6°
- Sea
- ± 15°
- Sun per day
- 5.6 h
- Rainy days
- 4
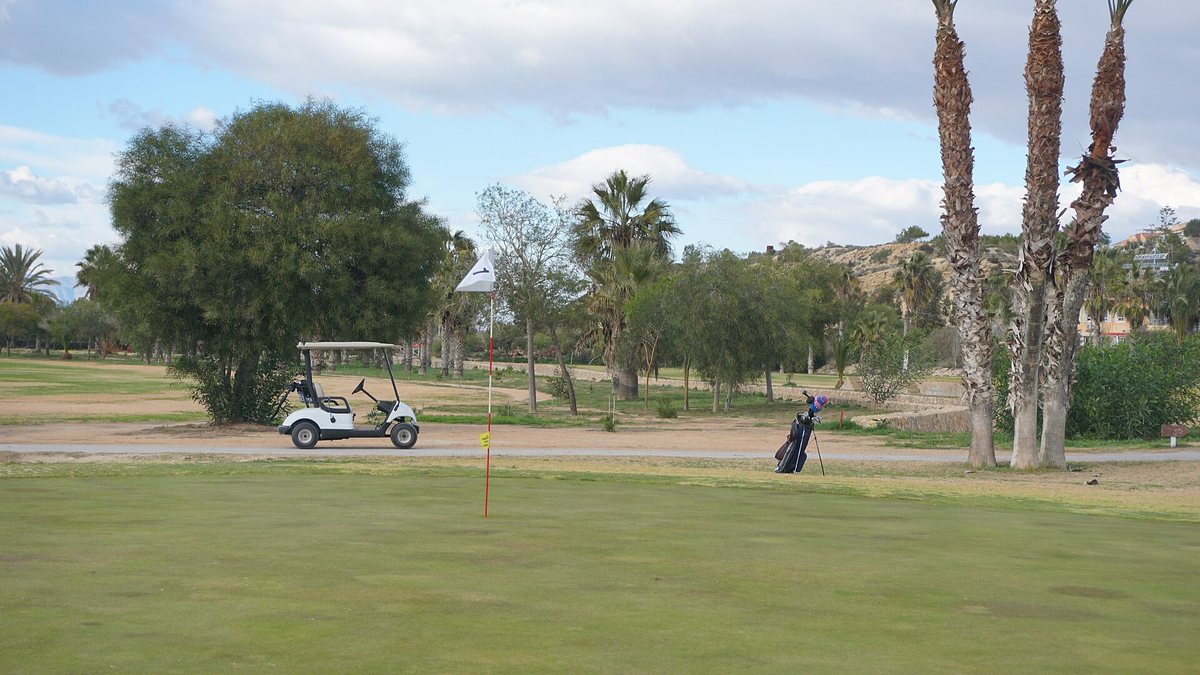
The coolest month, but often sunny: ideal for walking and golf.
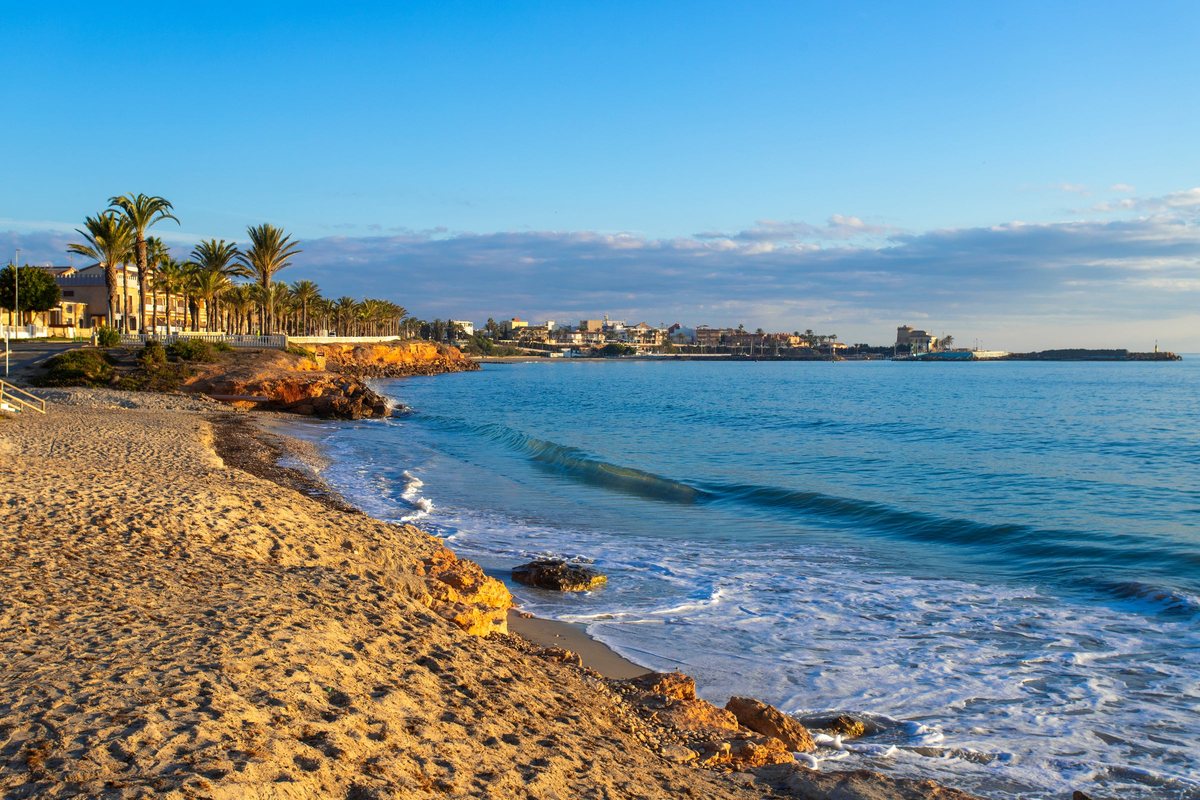
The area
Some 2,600 hours of sunshine a year, around 33 rainy days and mild winters. Here is what to expect, month by month.
In an average year this corner of Spain gets about 313 millimetres of rain, spread over roughly 33 days. Snow does not occur on the coast and frost hardly ever: about three days a year.
The figures on this page are the official 1981–2010 climate normals from AEMET, the Spanish meteorological agency, for the San Javier Aeropuerto weather station. It lies about 9 kilometres south of the penthouse, also right by the coast.
Climate table
Thirty-year averages measured at the San Javier Aeropuerto weather station, about 9 kilometres south of the penthouse.
| Month | Max | Min | Sea ± | Sun per day | Rainy days | Rainfall |
|---|---|---|---|---|---|---|
| January | 16.0° | 5.5° | 15° | 5.6 h | 3.7 | 42 mm |
| February | 16.7° | 6.5° | 15° | 6.1 h | 3.2 | 27 mm |
| March | 18.5° | 8.4° | 15° | 6.6 h | 3.2 | 24 mm |
| April | 20.4° | 10.2° | 16° | 7.5 h | 2.9 | 23 mm |
| May | 22.9° | 13.8° | 19° | 8.6 h | 3.0 | 25 mm |
| June | 26.4° | 17.9° | 22° | 9.6 h | 1.1 | 7 mm |
| July | 28.9° | 20.7° | 25° | 9.9 h | 0.4 | 2 mm |
| August | 29.5° | 21.5° | 27° | 9.1 h | 0.8 | 7 mm |
| September | 27.5° | 18.9° | 25° | 7.5 h | 2.6 | 39 mm |
| October | 24.0° | 14.7° | 23° | 6.5 h | 3.6 | 39 mm |
| November | 19.8° | 10.0° | 19° | 5.4 h | 4.4 | 47 mm |
| December | 16.9° | 6.8° | 17° | 5.0 h | 4.1 | 30 mm |
| Year | 22.3° | 12.9° | 2621 h | 32.9 | 313 mm |
Source for air, sunshine and rain: AEMET, climate normals 1981–2010, San Javier Aeropuerto station. Rainy day: at least 1 mm. Sea: rounded satellite-based averages for Cabo de Palos, not an official series.
The sea
The Mediterranean is coolest in February and March, at around 15 °C. In June the temperature rises to about 22 °C, and in August the water is warmest at 26–27 °C. The sea stays warm well into September and October.
The shallow Mar Menor warms up faster than the open sea. At the end of September 2026, the official monitoring network still measured 26.5 °C in the lagoon.
We could not find official monthly averages for sea temperature. The values on this page are rounded satellite-based averages for Cabo de Palos.
Month by month
The coolest month, but often sunny: ideal for walking and golf.
Mild and dry. The sea is at its coolest.
Spring: longer days and about 18 °C in the daytime.
Pleasantly warm: good weather for cycling and city trips.
Almost nine hours of sun a day; the beach season starts in late May.
Summer: 26 °C and sea water around 22 °C. San Juan bonfires on 23 June.
The sunniest month, with almost ten hours of sun a day and hardly any rain.
The hottest month, with the warmest sea. Summer fiestas on the coast.
The sea is still warm. The wettest time of year begins.
Late summer: 24 °C in the daytime. The Fiestas del Pilar in town.
Almost 20 °C in the daytime. The wettest month, yet only four or five rainy days.
Mild winter weather at 17 °C, with the shortest days.
Best time to visit
A rule of thumb based on the climate figures above.
June to September: 26 to 30 °C in the daytime and sea water of about 22 to 27 °C. Late May and October are quieter and still mild.
October to May, with highs of 16 to 24 °C and only three or four rainy days a month. See golf.
Mid-October to May. From November to March, daytime temperatures are 16 to 20 °C. See cycling and walking.
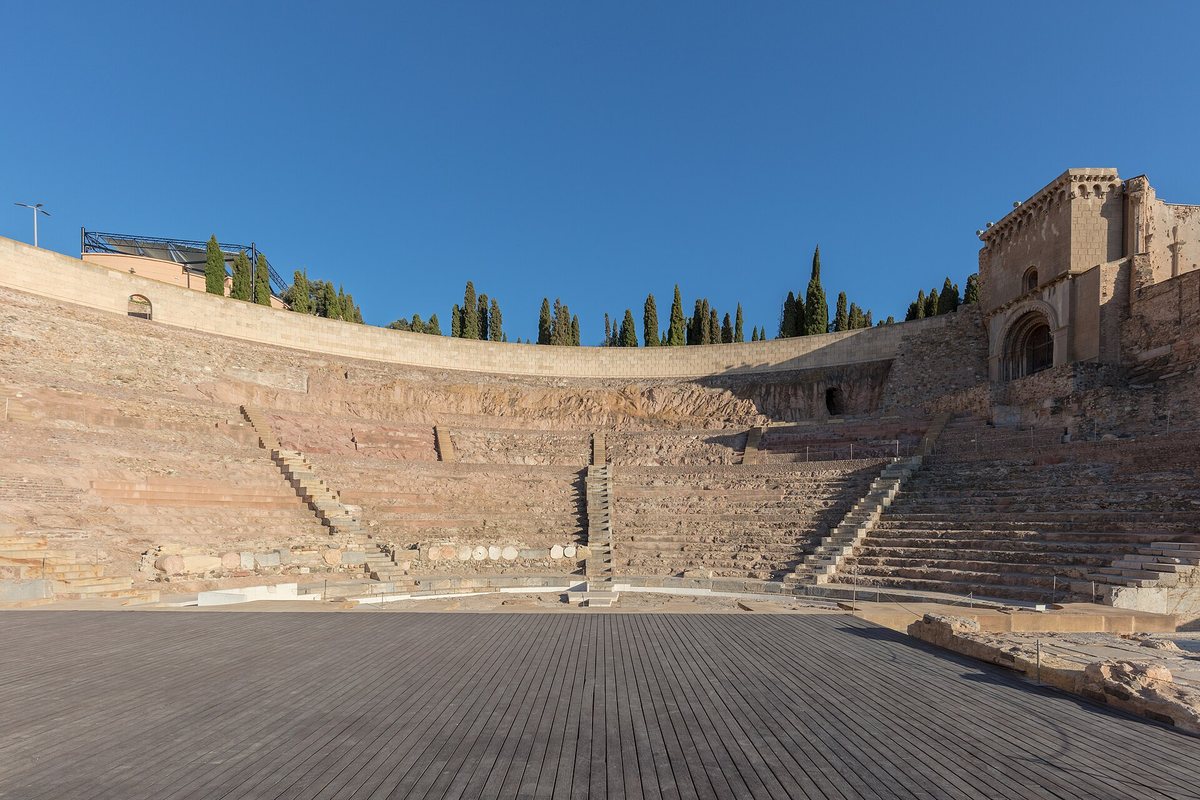
March to May and October to November. In Murcia city, July and August average 34 °C in the daytime. See day trips.
Holy Week in Cartagena, Murcia and Orihuela, the Hogueras in Alicante in June and the Fiestas del Pilar in October.
From November to April the low-season rate applies and the town and coast are quiet. See prices.
Calendar
A selection of festivals within about an hour’s drive.
| When | What | Where |
|---|---|---|
| 5 January | Three Kings parade | Every town, including Pilar |
| Holy Week (2027: 21–28 March) | Processions of International Tourist Interest | Cartagena, Murcia, Orihuela |
| Tuesday after Easter | Bando de la Huerta | Murcia |
| Saturday after Easter | Entierro de la Sardina | Murcia |
| 20–24 June | Hogueras de San Juan | Alicante |
| 23 June | San Juan bonfires on the beach | Torrevieja |
| July | Moros y Cristianos | Orihuela |
| Late July | Habaneras choral festival | Torrevieja |
| August | Summer fiestas on the coast | Mil Palmeras, El Mojón, Torre de la Horadada |
| 14–15 August | Misteri d’Elx (UNESCO) | Elche |
| Second half of September | Carthagineses y Romanos | Cartagena |
| 1–21 October | Fiestas del Pilar, with the float parade | Pilar de la Horadada |
Dates vary from year to year. Check the town’s website before you go.
More in the area

After a day out, the roof terrace is waiting. See when the penthouse is available.